

Search Website
Admission statistics
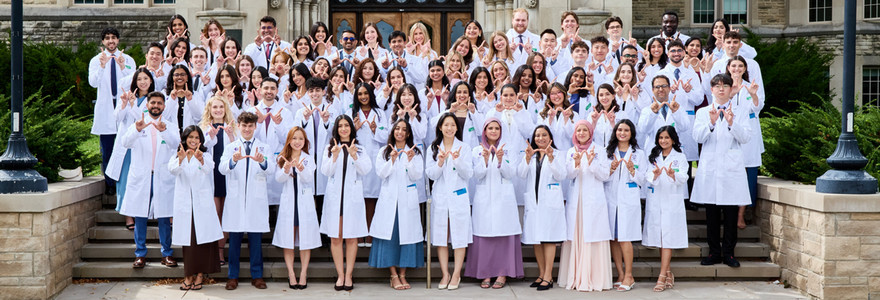
Meet the Dentistry Class of 2030
1,093
Applied
264
Interviewed
56
Admitted
DAT
20
RC threshold
23
RC average
20
PAT threshold
21
PAT average
Cumulative GPA
3.98
Average
3.72
Minimum
4.00
Maximum
Demographic profile
73%
Female
27%
Male
22½
Average age
Geographic profile
54
Domestic
2
Indigenous
-
International
Prior year statistics
Class of:
Applied
Interviewed
Admitted
DAT
RC threshold
RC average
PAT threshold
PAT average
GPA*
Average
Minimum
Maximum
2029
846
271
56
19
21
19
21
3.99
3.75
4.00
2028
727
201
56
19
22
19
21
4.00
3.73
4.00
2027
600
197
56
19
22
19
21
3.99
3.78
4.00
*2029 based on cumulative GPA; 2028 and 2027 based on 2 best years.